
Now that you have R and RStudio installed, I will show you how to use the software by first starting with the basics of just using RStudio as a fancy calculator. It is a much nicer calculator than a hand held calculator as it can provide help and feedback to make sure you are running the correct commands.
I am going to structure the blog post assuming that you are following along and running the commands in RStudio as we go.
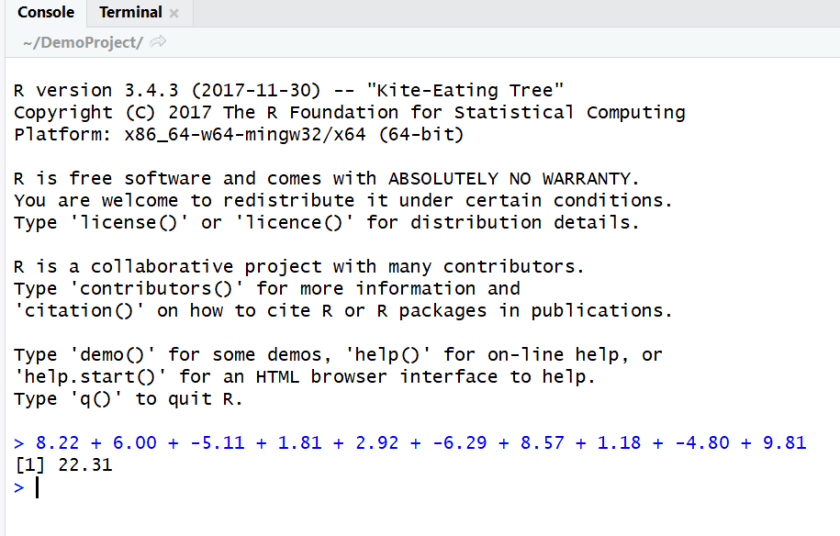
After installing RStudio and launching the application you should see something that looks like this:

Let’s get started!
RStudio R Console
The first thing you should notice in the Console is the version of R you are running. R likes to name their versions interesting names. The version this post is based on is “Kite-Eating Tree” aka version 3.4.3. If you have a different version than someone else it is possible that your results may be different than the other person, but that is generally not the case with basic functions, the focus of this blog post.
Let’s start out by calculating the mean of 10 numbers the “long” way or formula based way in R.
After the greater than symbol ( > ) in the Console type the following:
8.22 + 6.00 + -5.11 + 1.81 + 2.92 + -6.29 + 8.57 + 1.18 + -4.80 + 9.81
Hint, you can copy and paste it the above line! After pasting it, hit enter. You should see the following:
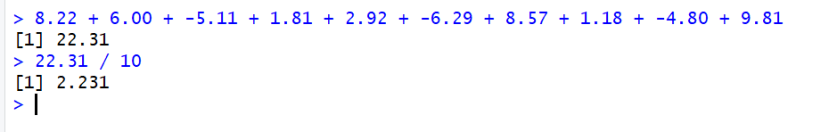
Now of course, that is not the mean but the sum of the 10 values, to find the mean we need to divide by 10. So we can divide 22.31 by 10:
22.31 / 10
Which gives us:
Now, let’s say we want to get more statistics on those 10 numbers. Then we really want to save them as a list of values in a variable that we can refer back to for various calculations.
When creating variable names you want to give it an informative name. Let’s say that these values represent the distance a Frisbee lands from a target. It could fall short or go too far. In this case, it looks like most went too far. So let’s name the variable “frisbeeDist”.
We will store the data in a vector using the R function “c( )” which means we will combine all of the values. The symbols “<-” means we are storing the values in that variable name.
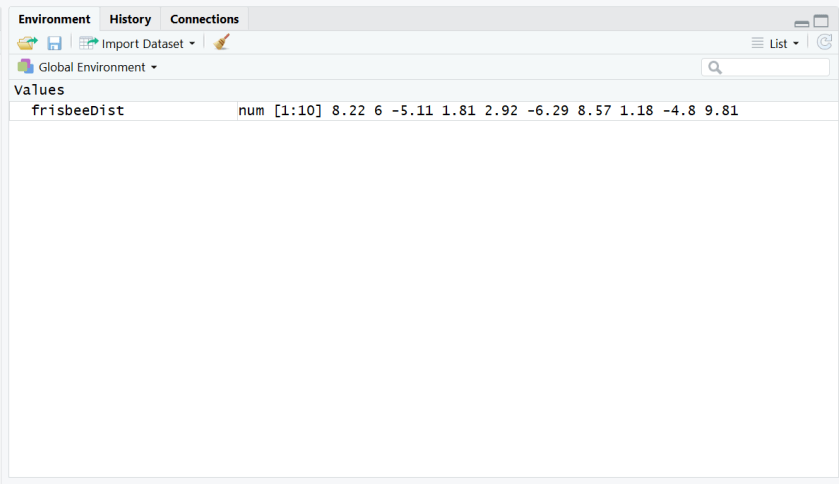
frisbeeDist <-c(8.22,6.00,-5.11,1.81,2.92,-6.29,8.57,1.18,-4.80,9.81)
Once you create a variable it looks like nothing happened, but if you check the Environment tab, you should see the variable and its values.
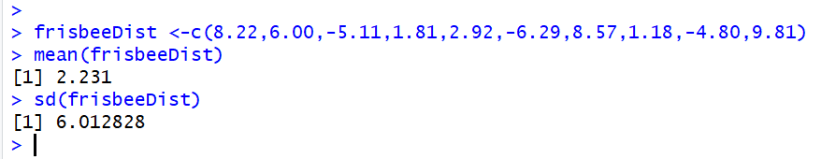
We can use this variable now to calculate the mean and the standard deviation of this data. The command to calculate a mean of a variable is “mean(x)” where x is the variable name. The command to calculate the standard deviation of a variable is “sd(x)” where x is the variable name. Here are those commands using the data stored in the frisbeeDist variable.
mean(frisbeeDist)
sd(frisbeeDist)
Using RStudio to calculate probabilities
In statistics, we generally no longer use tables to look up probabilities for distributions and we would prefer not to calculate discrete probabilities by hand if the distribution of the data is a named distribution.
Commands for Families of Discrete Random Variables
Let’s start with the binomial distribution. This is a distribution for a discrete random variable so we can compute the probability that X is a specific number as well as the cumulative probabilities.
In R to find the probability that X takes on a certain number we will use the function “dbinom(x, size, probability)”. The “d” stands for density or mass of the probability at that value of x.
To find the cumulative probability that X takes on all values up to and including a particular value we will use the function “pbinom(x, size, probability)”. The “p” stands for distribution function.
Example: Each of 6 randomly selected soda drinkers is given a glass containing Coke and a glass containing Pepsi. The glasses are identical except for a code on the bottom to ID the drink. Suppose the tendency among soda drinkers to prefer Coke to Pepsi is 60%. Let X= the number among the 6 who prefer Coke.
What is the probability that exactly 3 people prefer Coke?
To find this we want to find P(X=3), so our x value is 3, the sample size is 6, and the probability is 0.60 and we use “dbinom”. Run the following code to find the probability.
dbinom(3, 6, 0.6)

Answer: P(X=3) = 0.276
What is the probability that at most 3 people prefer Coke?
To find this we want to find P(X ≤ 3), so the x value is still 3, the sample size is 6, and the probability is 0.60 and we use “pbinom”. Run the following code to find the probability.
pbinom(3, 6, 0.6)
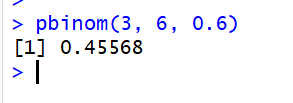
Answer: P(X ≤ 3)=0.4557
There are similar commands for hypergeometric, negative binomial, Poisson, and other discrete random variable distribution families.
Commands for Families of Continuous Random Variables
For continuous random variables it does not make sense to compute a probability at a point as that will always be zero. However the cumulative density function is of great importance. This function is still prefaced with a “p”. Also of interest is calculating percentiles of distributions. This is prefaced with a “q” which stands for quantile. R could not use “p” as it was already taken for the cumulative density function.
To consider these commands, let’s take the normal distribution. The command for a probability that X takes on all values up to and including a certain value is given by the command “pnorm(x, mean, standard deviation)”. To find the percentile or value of x that results in a certain probability to the left of the unknown x we use the command “qnorm(probability, mean, standard deviation)”.
Example: Suppose that adult male polar bears weigh on average 370 kg with a standard deviation of 88 kg.
What is the probability that a randomly selected adult male polar bear will weigh less than or equal to 355 kg?
To find this we want to find P(X ≤ 355), so the x value is 355, the mean is 370 and the standard deviation is 88.
pnorm(355, 370, 88)

Answer: P(X <= 355) = 0.4323 or 43.23%
What weight of adult male polar bears corresponds to the 35th percentile?
To find this we want to find x such that P(X ≤ x) = 0.35, so the probability is 0.35, the mean is 370 and the standard deviation is 88.
qnorm(0.35, 370, 88)
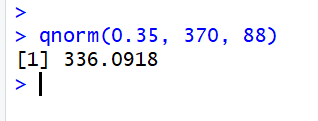
Answer: 35% of adult male polar bears will weigh less than 336.09 kg.
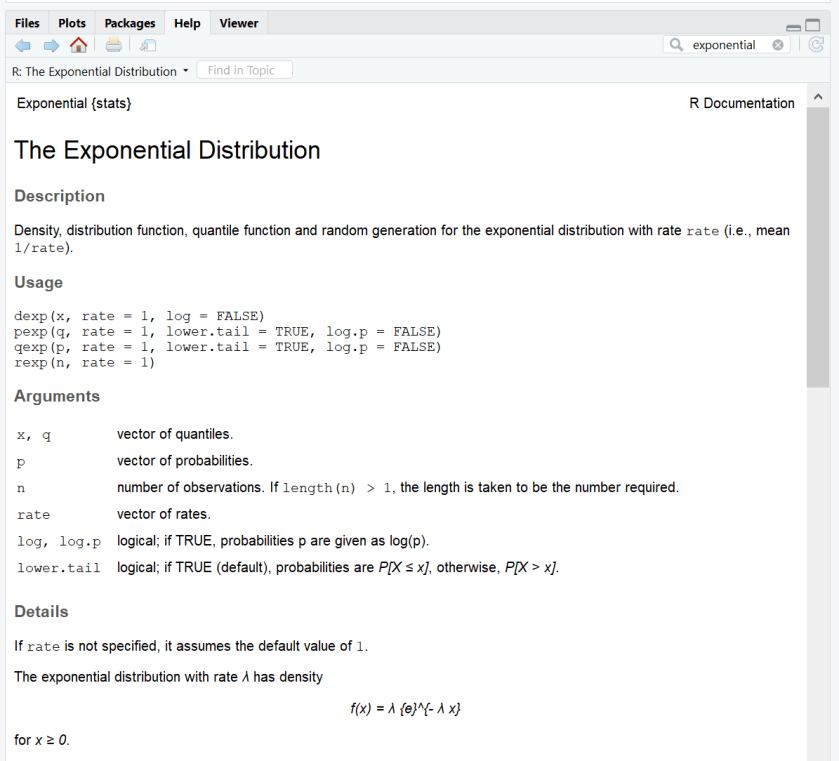
There are similar commands for exponential, gamma, beta, chi-squared and other continuous random variable distribution families.
Getting help on R Commands in RStudio
On the lower right hand side of the RStudio window there are 5 tabs, Files, Plots, Packages, Help, and Viewer. If you click on the Help tab there is a search box. In that box you can either type a search string or a command name if you know it.
If you type a search string it will bring up results from various sources. When getting started with R you will most likely want any solutions that are in the base package or in the stats package so prefer results that have “base::” or “stats::” in front of them.

If you click on the “stats::Exponential” link it brings you to a help page for that topic:
What’s Next?
The next two blog posts will cover how to save and re-use commands in R scripts (and why you might want to do that) and how to import data into RStudio to do analysis on sample data.
If you have any questions please don’t hesitate to reach out to greatlineswriting@outlook.com!

One thought on “Learning How to Use RStudio as a Calculator”
Comments are closed.